Report analyzes the political impact of 3 Utah congressional maps being weighed by judge
Utah Legislature’s choice ‘keeps the current partisan skew,’ Better Utah Institute report says. The plaintiffs’ maps would either create 1 safe Democratic district and 3 safe Republican districts, or create 1 ‘competitive’ district.

Spenser Heaps for Utah News Dispatch
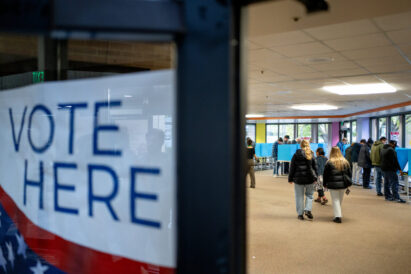
People arrive to vote at the Salt Lake County Government Center in Salt Lake City on Election Day on Tuesday, Nov. 5, 2024.A new analysis breaks down the political implications of three proposed congressional maps that have been submitted to a Utah judge for consideration — one from Utah lawmakers and two from the plaintiffs in the ongoing redistricting lawsuit against the state.
The three biggest takeaways from the report by the Better Utah Institute — a nonpartisan nonprofit that is related to the progressive advocacy group Alliance for a Better Utah — come down to the following:
- The Utah Legislature’s map, Option C, “keeps the current partisan skew intact – uncompetitive, tilted strongly Republican, with a glaring efficiency gap.”
- The plaintiffs’ Map 1 “corrects the partisan imbalance neatly by creating one safe Democratic district and three safe Republican ones,” the report says. “It’s fairer by the numbers but still largely noncompetitive.”
- The plaintiffs’ Map 2 “creates one district with closer margins between parties, increasing competitiveness while maintaining proportionality.”
The Better Utah Institute analysis doesn’t pick a preferred map, but shows there’s a “clear divide” between the Utah Legislature’s map and the plaintiffs’ maps.
While the plaintiffs’ maps align more closely with statewide vote share, the Legislature’s map “maintains the existing partisan distribution,” the analysis concludes. “Each map reflects different trade-offs between fairness, competition, and community representation.”
The report comes as Utah’s rare, mid-decade redistricting process transitions from a special session at the Utah Capitol on Monday, when lawmakers convened to vote on their preferred map to submit to a judge for further consideration. The Republican-controlled Legislature chose a map that the Utah Republican Party last week encouraged its members to support, while Democrats criticized it as the worst option.
The same day, the plaintiffs in the redistricting lawsuit — which led to the court ruling that voided the 2021 congressional boundaries and initiated the court-ordered redistricting process now underway to remedy that map — submitted two maps to 3rd District Judge Dianna Gibson.
Now, Utah’s redistricting process moves to the courtroom. Gibson will decide which map meets legal and constitutional standards. At the very latest, state elections officials have said a new map must be adopted by Nov. 10 so counties can use it to prepare for the 2026 elections.
Under the 2021 congressional map that’s since been voided by the courts as the result of an unconstitutional process, Republicans have easily dominated all four of Utah’s U.S. House seats. However, depending on the map that ultimately gets adopted for the 2026 elections, Utah voters may have a better chance of electing a Democratic member of Congress for the first time since then-Rep. Ben McAdams was elected in 2018.
“The stakes couldn’t be higher,” the report says. “Congressional district boundaries influence who wins elections, how accountable lawmakers are to their constituents, and whether communities feel truly represented. A fair map doesn’t guarantee political outcomes for any party but it does ensure that voters’ voices are accurately reflected at the ballot box.”
To help Utahns understand the impacts of each map, the Better Utah Institute analysis uses five redistricting metrics: proportionality, competitiveness, compactness, splitting, and the efficiency gap.
“Together, these measures provide a clearer picture of how each map would translate voters’ choices into actual political power,” the report says.
Here’s a breakdown of each of those criteria:
- Proportionality: How closely the share of seats a party wins matches its overall share of the statewide vote. A higher score on a scale of 0 to 100 indicates a more proportional map.
- Competitiveness: How likely it is that more than one political party has a real chance of winning in a district. A higher score on a scale of 0 to 100 indicates a more competitive map.
- Compactness: How geographically tight and regularly shaped a district is, instead of being stretched or oddly contorted. A higher score on a scale of 0 to 100 indicates a more compact map.
- Splitting: How often a map divides cities and counties between multiple districts, with lower scores indicating fewer unnecessary splits.
- Efficiency Gap: How much one party wastes more votes than the other through packing and cracking, indicating partisan bias in a map.
- Partisan Margin: The number of percentage points one party is expected to win over the other in a given district, based on recent election results or projections.
Utah News Dispatch is part of States Newsroom, the nation’s largest state-focused nonprofit news organization.