Utah State BOE releases yearly school report card; Provo district showing slides


-
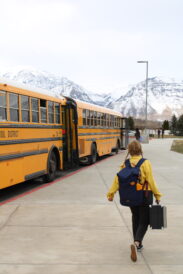
- A student walks to her bus outside of Provo High School on March 29, 2023.
-
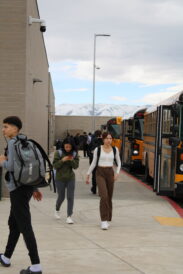
- Students board buses outside of Provo High School on Wednesday, March 29, 2023.
On Tuesday, the Utah State Board of Education released the School Report Card, a tool designed to highlight each school’s strengths and show areas in need of improvement.
For the Provo City School District, it appears there are more areas in need of improvement than in the past two years, with percentages either stagnant or on the decline — particularly in English, math and science.
“The Provo community has identified that excellence in education is very important to them and we know that we have some work to do as a district,” said Superintendent Wendy Dau. “We also know that these data points do not tell a school’s or a district’s entire story. However, they are important indicators to help us understand how we need to serve our students more effectively and we owe it to our community to accomplish this. Everyone in Provo City School District is committed to improving outcomes for all students.”
According to statement by the USBE, the Utah School Report Card allows parents to examine school performance indicators, such as achievement and growth, similar to an individual student’s report card.
“Reviewing the school report card for your community school is a great way to learn more about the school’s strengths and areas they are working to improve,” State Superintendent of Public Instruction Sydnee Dickson said in a press release. “We encourage everyone to review this interactive online tool designed to support transparency and promote continuous improvement.”
Each spring, students are assessed in the concepts and skills taught in the classroom, measuring student learning and the Utah State Standards.
About 96% of Provo students participated. For the Provo district, the school report card showed lower achievement percentages — representing the amount of students who demonstrated mastery of grade-level standards in each subject — in English, math and science than the state average:
- English was 45%, with the state average at 46%. That number has declined each year of the past two years, dropping from 54.7% in 2020-2021.
- Math was 26%, with the state average at 31%. That’s lower than the 30.6% recorded in 2020-2021.
- Science was 30% for the district, with the state average at 35%. The percentage was also 30% in 2020-2021 and had risen in 2021-2022 to 35.4%.
When it comes to performance by race, the report shows a disparity between caucasian students at 58% achievement, Asian students at 54%, multiracial students at 49%, Hispanic students at 21%, Pacific Islander students at 22% and Black/African American students at 25%.
However, it does show that attendance appears to be better and rising.
Schools may choose to describe up to two additional pieces of information about how their school is supporting students. These self-reported indicators are not factored into school accountability calculations but provide the opportunity for schools to highlight successful programs or practices in addition to the indicators included in school accountability.
To view the full report, visit https://reportcard.schools.utah.gov.
Local News
Talkin’ transportation: How MAG plans the future of travel in Utah County

Gov. Cox says his Utah Supreme Court picks were the most qualified. Critics disagree